Measuring Impact: Top 4 Attribution and Incrementality Strategies

I believe you have gone through part 1 and understood what Attribution and Incrementality mean and why it is important to measure these metrics. Below, we will discuss some methods that are commonly used across the industry to achieve our goals.
Before we dive into the methods, let us understand the term Randomised Controlled Trials (RCT). And by the way, in common jargon, they are popularly known as A/B tests.
What are Randomized Controlled Trials (RCT)?
Simply put, it is an experiment that measures our hypothesis. Suppose we believe (hypothesis) that the new email creative (experiment) will perform (measure) better than the old email creative. Now, we will randomly split our audience into 2 groups. One of them, the control group, keeps receiving the old emails, and the other, the test group, keeps receiving the new email creative.
Now how do you quantify your measure? How do you understand your experiment is performing better? Choose any metric that you think should determine the success of the new email creatives. Say, Click-through Rate (CTR). Thus, if the test group has a better CTR than the control group, you can say that the new email creative is performing better than the old email creative.
Some popular methods to run experiments:
Method 1:
User-Level Analysis
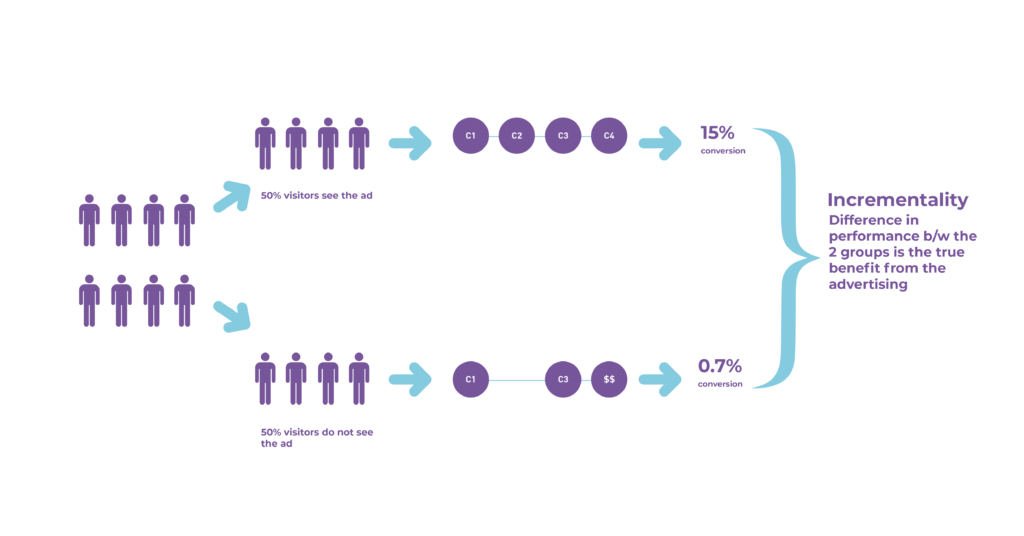
Illustration for Incrementality
One of the simple ways to quantify incrementality would be to run an experiment as done in the diagram. Divide your sample into two random groups. Expose the groups to a different treatment; for example, one group receives a particular email/ad, and the other does not.
The difference in the groups reflects the true measurement of the treatment. This helps us quantify the impact of sending an email or showing a particular ad.
Method 2:
Pre/Post Analysis
This is an experiment that can be used to measure the effect of a certain event or action by taking a measurement before (pre) and after (post) the start of the experiment.
You can introduce a new email campaign during the test period and measure the impact over time of any metric of your interest by comparing it against the time when the new email campaign was not introduced.
Thus, by analyzing the difference in the impact of the metric you can estimate the effect of your experiment.
Things to keep in mind while performing pre/post analysis:
- Keep the control period long enough to get significant data points
- Keep in mind that there might be spillover in results during the test phase, so we should ensure that the impact of this spillover is not missed
- Ensure that you keep enough time for the disruption period. It refers to the transient time just after you have launched the experiment
- It is ideal to avoid peak seasons or other high volatility periods in the business for these experiments to yield conclusive results
Method 3:
Natural Experiment
It is similar to the A/B test, where you can observe the effect of a treatment (event, feature) on different samples but not having the ability to define/control the sample. So, it is similar to Randomised Controlled Trial, but you cannot control the environment of the experiment.
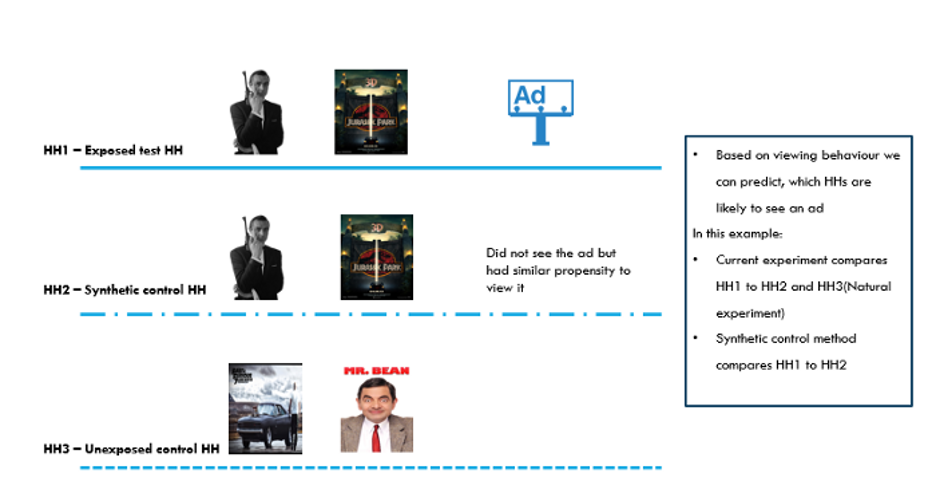
Suppose you want to understand the impact of a certain advertisement. If you do what we have explained above in Method 1, and create 2 groups, a control group that is not shown the particular advertisement and a test group that has been shown the ad and try to measure the impact of the advertisement, you might make a basic mistake. The groups may not be homogenous to start with. The behavior of the groups can be different from the start itself, so you are expected to see very different results and thus cannot be sure of the effectiveness of the ad.
We need to decrease the bias by attempting resampling and reweighting techniques. To tackle this, we can create Synthetic Control Groups(SCGs).
Find below an example with an illustration for the scenario:
We will create SCGs within the unexposed groups. We will try to understand which households (HHs) missed an ad, but based on their viewing habits are similar to those households (HHs) which have seen one.
Images:
James Bond: This Photo by Unknown Author is licensed under CC BY-NC;
Jurrasic park: This Photo by Unknown Author is licensed under CC BY-NC-ND;
Fast and Furious: This Photo by Unknown Author is licensed under CC BY-NC-ND;
Mr Bean: This Photo by Unknown Author is licensed under CC BY-NC
Another sub-method that is out of the scope for this blog is to attach a weight to every household based on their demographics attributes(gender, age, income, etc) using iterative proportional fitting and the comparison happens on the weighted results.
Method 4:
Geo Measurement
Geo measurement is a method that utilizes the ability to spend and/or market in one geographic area (hence “geo”) vs. another. A typical experiment consists of advertising in one geo (the “on” geo) and holding out another geo (the “off” geo), and then measuring the difference between them i.e., the incrementality caused by the treatment. One also needs to account for pre-test differences between on and off geographies either by normalizing these before evaluation or adjusting for this post-hoc analysis.
— — — — — — — — — — — — — — — — — — — — — — — — — — — — — —
Hope this helps as a good starting point in understanding what attribution and incrementality are and how it is utilized in the industry.