Product Life Cycle Management in Apparel Industry
Product Life Cycle Estimation
“Watch the product life cycle; but more important, watch the market life cycle”
~Philip Kotler
Abstract
The product life cycle describes the period over which an item is developed, brought to market and eventually removed from the market.
This paper describes a simple method to estimate Life Cycle stages – Growth, Maturity, and Decline (as seen in the traditional definitions) of products that have historical data of at least one complete life cycle.
Here, two different calculations have been done which helps the business to identify the number of weeks after which a product moves to a different stage and apply the PLC for improving demand forecasting.
A log-growth model is fit using Cumulative Sell through and Product Age which helps to identify the various stages of the product. A Log-Linear model is fit to determine the rate of change of product sales due to a shift in its stage, cet. par.
The life span of a product and how fast it goes through the entire cycle depends on market demand and how marketing instruments are used and vary for different products. Products of fashion, by definition, have a shorter life cycle, and they thus have a much shorter time in which to reap their reward.
An Introduction to Product Life Cycle (PLC)
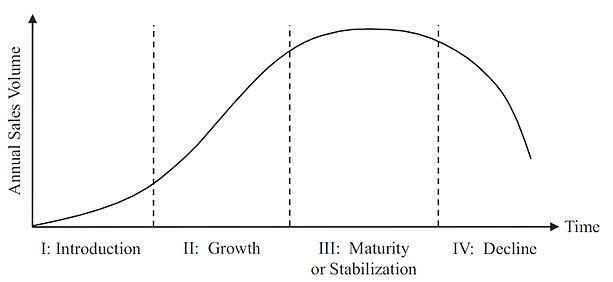
Historically, PLC is a concept that has been researched as early as 1957 (refer Jones 1957, p.40). The traditional definitions mainly described 4 stages – Introduction, Growth, Maturity, and Decline. This was used mainly from a marketing perspective – hence referred to as Marketing-PLC.
With the development of new types of products and additional research in the field, Life Cycle Costing (LCC) and Life Cycle Assessment (LCA) were added to the traditional definition to give the Engineering PLC (or E-PLC). This definition considers the cost of using the product during its lifetime, services necessary for maintenance and decommissioning of the product.
According to Philip Kotler, ‘The product life cycle is an attempt to recognize distinct stages in sales history of the product’. In general, PLC has 4 stages – Introduction, Growth, Maturity, and Decline. But for some industries which consist of fast moving products, for example, apparel PLC can be defined in 3 stages. PLC helps to study the degree of product acceptance by the market over time which includes major rise or fall in sales.
PLC also varies based on product type that can be broadly divided into:
- Seasonal – Products that are seasonal (for e.g. mufflers, that are on shelves mostly in winter) have a steeper incline/decline due to the short growth and decline periods.
- Non-Seasonal – Products that are non-seasonal (for e.g. jeans, that are promoted in all seasons) have longer maturity and decline periods as sales tend to continue as long as stocks last.
Definition of Various Stages of PLC
Market Development & Introduction
This is when a new product is first brought to market before there is a proved demand for it. In order to create demand, investments are made with respect to consumer awareness and promotion of the new product in order to get sales going. Sales and Profits are low and there are only a few competitors in this stage.
Growth
In this stage, demand begins to accelerate and the size of the total market expands rapidly. The production costs and high profits are generated.
Maturity
The sales growth reaches a point above which it will not grow. The number of competitors increases and so market share decreases. The sales will be maintained for some period with a good profit.
Decline
Here, the market becomes saturated and the product is no longer sold and becomes unpopular. This stage can occur as a natural result but can also be due to introduction of new and innovative products and better product features from the competitors.
This paper deals with the traditional definition of PLC and the application in Fashion products.
Why do Businesses Need PLC and How Does it Help Them?
Businesses have always invested significant amounts of resources to estimate PLC and demand. Estimating the life cycle of a new product accurately helps business take several key decisions, such as:
- Provide promotions and markdowns at the right time.
- Plan inventory levels better by incorporating PLC in demand prediction.
- Plan product launch dates/season.
- Determine the optimal discount percentages based on a product’s PLC stage (as discussed later in this paper).
Businesses primarily rely on the business sense and experience of their executives to estimate a product’s life cycle. Any data driven method to easily estimate PLC can help reduce costs and improve decision making.
How Does the Solution in this Paper Help?
The solution detailed in this paper can help businesses use data of previously launched products to predict the life cycles of similar new products. The age at which products transition from one life cycle phase to another as well as the life cycle curves of products can be obtained through this process. This also helps to identify the current stage of the products and the rate of sales growth during stage transition.
Below is an overview of the steps followed to achieve these benefits:
- To identify products similar to a newly released product, we clustered products based on the significant factors affecting sales. This gives us a chance to obtain a data based PLC trend.
- Next, sales is used to plot the Cumulative Sell Through Rate vs Product Age (in weeks).
- A log-growth model fit across this plot will provide the Life Cycle trend of that product or cluster of products.
- The second differential of this curve can be analyzed to identify shifts in PLC phases, to estimate the durations of each of the PLC phases.
Detailed Approach to Estimate PLC
The process followed to determine the different PLC stages is a generic one that can be incorporated into any model. However, in this paper, we have described how it was employed to help determine the effect of different PLC stages on sales for the apparel industry.
The procedure followed has been described in detail in the steps below:
i. Product Segmentation
The first step in estimating PLC is to segment products based on the features that primarily influence sales.
To predict the life cycle factor in demand prediction of a new product, we need to find similar products among those launched previously. The life cycle of the new product can be assumed to be similar to these.
ii. Identification of PLC Stages
To identify various stages, factors like Cumulative Sell through rate and Age of product were considered. The number of weeks in each stage was calculated at category level which consists of a group of products.
Cumulative sell through is defined as the cumulative Sales over the period divided by the total inventory at the start of the period. Sales of products were aggregated at category level by using the sum of sales at similar product age. For example, Sales of all products when the age was 1 week being aggregated, to get the sales of that category on week 1.
After exploring multiple methods to determine the different stages, we have finally used a log-growth model to fit a curve between age and cumulative sell through. Its equation is given below for reference:
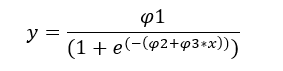
Note: Φ1, Φ2 & Φ3 are parameters that control the asymptote and growth of the curve.
Using inflexion points of the fitted curve cut-off for different phases of product life cycle were obtained.
The fitted curve had 2 inflexion points that made it easy to differentiate the PLC stages.
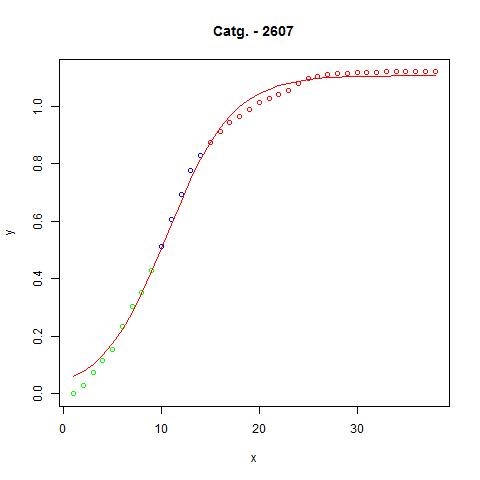
The plot above shows the variation of Cumulative sell through rate (y-axis) vs Age (x-axis). The data points are colored based on the PLC life stage identified: Green for “Growth Stage”, Blue for “Maturity Stage” and Red for “Decline Stage”.
Other Methods Explored
Several other methods were explored before determining the approach discussed in the previous section. The decision was based on the advantages and drawbacks of each of the methods given below:
Method 1:
Identification of PLC stages by analyzing the variation in Sell through and Cumulative Sell through.
Steps followed:
- Calculated (Daily Sales / Total Inventory) across Cumulative Sell through rate at a category level
- A curve between Cumulative Sell through rate (x-axis) and (Daily Sales / Total Inventory) in the y-axis was fitted using non-linear least square regression
- Using inflexion points of the fitted curve cut-off for different phases of product life cycle is obtained
Advantages: The fitted curve followed a ‘bell-curve’ shape in many cases that made it easier to identify PLC stages visually.
Drawbacks: There weren’t enough data points in several categories to fit a ‘bell-shaped’ curve, leading to issues in the identification of PLC stages.
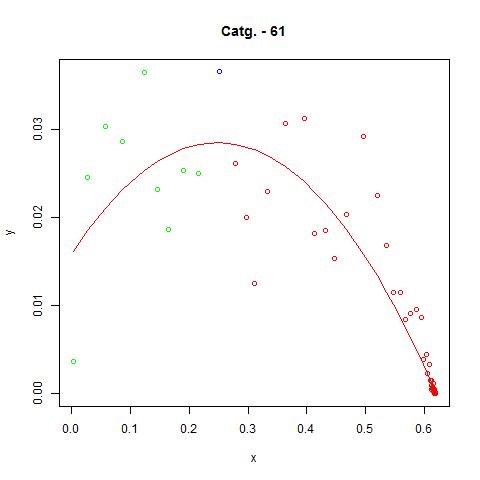
The plot above shows the variation of Total Sales (y-axis) vs Age (x-axis). The data points are colored based on the PLC life stage identified: Green for “Growth Stage”, Blue for “Maturity Stage” and Red for “Decline Stage”.
Method 2:
Identification of PLC stages by analyzing the variation in cumulative sell through rates with age of a product (Logarithmic model).
Steps followed:
- Calculated cumulative sell through rate across age at a category level.
- A curve between age and cumulative sell through rate was fitted using a log linear model.
- Using inflexion points of the fitted curve cut-off for different phases of product life cycle is obtained.
Drawbacks:
- Visual inspection of the fitted curve does not reveal any PLC stages.
- This method could not capture the trend as accurately as the log-growth models.
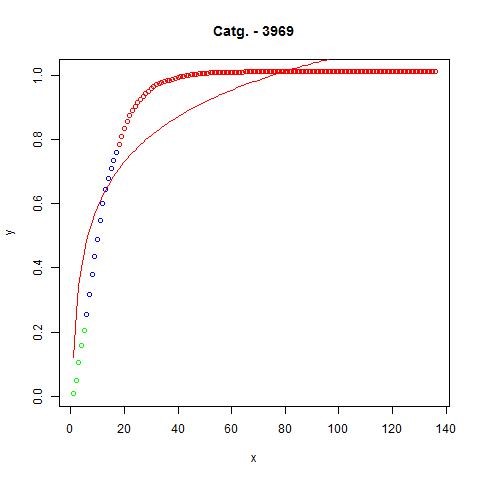
The plot above shows the variation of Cumulative sell through rate (y-axis) vs Age (x-axis). The data points are colored based on the PLC life stage identified: Green for “Growth Stage”, Blue for “Maturity Stage” and Red for “Decline Stage”.
Application of PLC stages in Demand Prediction
After identifying the different PLC phases for each category, this information can be used directly to determine when promotions need to be provided to sustain product sales. It can also be incorporated into a model as an independent categorical variable to understand the impact of the different PLC phases on predicting demand.
In the context of this paper, we used the PLC phases identified as a categorical variable in the price elasticity model to understand the effect of each phase separately. The process was as follows:
The final sales prediction model had data aggregated at a cluster and sales week level. PLC phase information was added to the sales forecasting model by classifying each week in the cluster-week data into “Growth”, “Maturity” or “Decline”, based on the average age of the products in that cluster and week.
This PLC classification variable was treated as a factor variable so that we can obtain coefficients for each PLC stage.
The modeling equation obtained was:

In the above equation, “PLC_Phase” represents the PLC classification variable. The output of the regression exercise gave beta coefficients for the PLC stages “Growth” and “Maturity” with respect to “Decline”.
The “Growth” and “Maturity” coefficients were then treated such that they were always positive. This was because “Growth” and “Maturity” coefficients were obtained w.r.t. “Decline” and since “Decline” had a factor of 1, the other 2 had to be greater than 1.
The treated coefficients obtained for each cluster were used in the simulation tool in the following manner (more details given in tool documentation):
- If there is a transition from “Growth” to “Maturity” stages in a product’s life cycle – then the PLC factor multiplied to sales is (“Maturity” coefficient / “Growth” coefficient).
- If there is a transition from “Maturity” to “Decline” stages in a product’s life cycle – then the PLC factor multiplied to sales is (“Decline” coefficient / “Maturity” coefficient).
- If there is no transition of stages in a product’s life cycle, then PLC factor is 1.
Conclusion
The method described in this paper enables identification of PLC stages for the apparel industry and demand prediction for old and new products. This is a generalized method and can be used for different industries as well, where a product may exhibit 4 or 5 stages of life cycle.
One of the drawbacks of product life cycle is that it is not always a reliable indicator of the true lifespan of a product and adhering to the concept may lead to mistakes. For example, a dip in sales during the growth stage can be temporary instead of a sign the product is reaching maturity. If the dip causes a company to reduce its promotional efforts too quickly, it may limit the product’s growth and prevent it from becoming a true success.
Also, if there are a lot of promotional activities or discount are applied, then it’s difficult to identify the true-life cycle.
References
Below are links to certain websites referred to:
- https://insight.kellogg.northwestern.edu/article/how-to-predict-demand-for-your-new-product-2
- http://www.investopedia.com/terms/p/product-life-cycle.asp
- http://www.economist.com/node/14301365
- https://hbr.org/1965/11/exploit-the-product-life-cycle
- http://fashion2apparel.blogspot.in/2017/04/apparel-product-life-cycle.html
- https://www.interaction-design.org/index.php/literature/article/how-to-use-the-product-life-cycle
- https://bscheng.com/2014/05/07/modeling-logistic-growth-data-in-r/