Statistical Model Lifecycle Management

Organizations have realized quantum jumps in business outcomes through the institutionalization of data-driven decision making. Predictive Analytics, powered by the robustness of statistical techniques, is one of the key tools leveraged by data scientists to gain insight into probabilistic future trends. Various mathematical models form the DNA of Predictive Analytics.
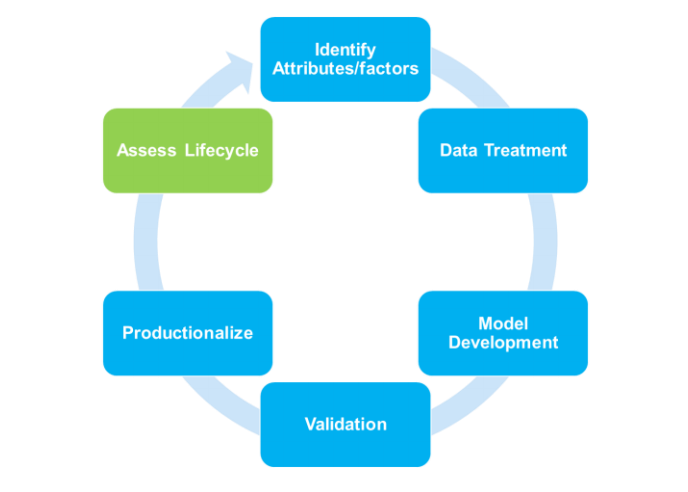
A typical model development process includes identifying factors/drivers, data hunting, cleaning and transformation, development, validation – business & statistical and finally productionisation. In the production phase, as actual data is included in the model environment, true accuracy of the model is measured. Quite often there are gaps (error) between predicted and actual numbers. Business teams have their own heuristic definitions and benchmark for this gap and any deviation leads to forage for additional features/variables, data sources and finally resulting in rebuilding the model.
Needless to say, this leads to delays in the business decision and have several cost implications.
Can this gap (error) be better defined, tracked and analyzed before declaring model failure? How can stakeholders assess the Lifecycle of any model with minimal analytics expertise?
At Affine, we have developed a robust and scalable framework which can address above questions. In the next section, we will highlight the analytical approach and present a business case where this was implemented in practice.
Approach
The solution was developed based on the concepts of Statistical Quality Control esp. Western Electric rules. These are decision rules for detecting “out-of-control” or non-random conditions using the principle of process control charts. Distributions of the observations relative to the control chart indicate whether the process in question should be investigated for anomalies.
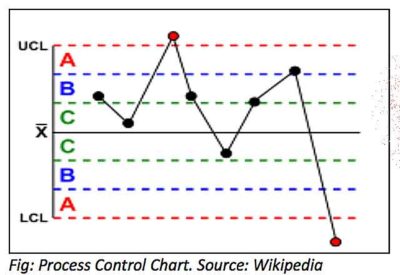
X is the Mean error of the analytical model based on historical (model training) data. Outlier analysis needs to be performed to remove any exceptional behavior.
Zone A = Between Mean ± (2 x Std. Deviation) & Mean ± (3 x Std. Deviation)
Zone B = Between Mean ± Std. Deviation & Mean ± (2 x Std. Deviation)
Zone C = Between Mean & Mean ± Std. Deviation.
Alternatively, Zone A, B, and C can be customized based on the tolerance of Std. Deviation criterion and business needs.
| Rule | Details |
| 1 | Any single data point falls outside the 3σ limit from the centerline (i.e., any point that falls outside Zone A, beyond either the upper or lower control limit) |
| 2 | Two out of three consecutive points fall beyond the 2σ limit (in zone A or beyond), on the same side of the centerline |
| 3 | Four out of five consecutive points fall beyond the 1σ limit (in zone B or beyond), on the same side of the centerline |
| 4 | Eight consecutive points fall on the same side of the centerline (in zone C or beyond) |
If any of the rules are satisfied, it indicates that the existing model needs to be re-calibrated.
Business Case
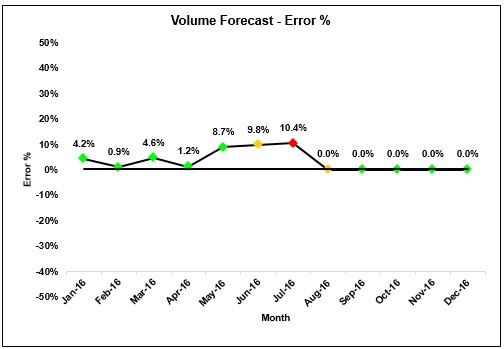
A large beverage company wanted to forecast industry level demand for a specific product segment in multiple sales geographies. Affine evaluated multiple analytical techniques and identified a champion model based on accuracy, robustness, and scalability. Since the final model was supposed to be owned by client internal teams, Affine enabled assessing lifecycle stage of a model through an automated process. A visualization tool was developed which included an alert system to help user proactively identify for any red flags. A detailed escalation mechanism was outlined to address any queries or red flags related to model performance or accuracies.
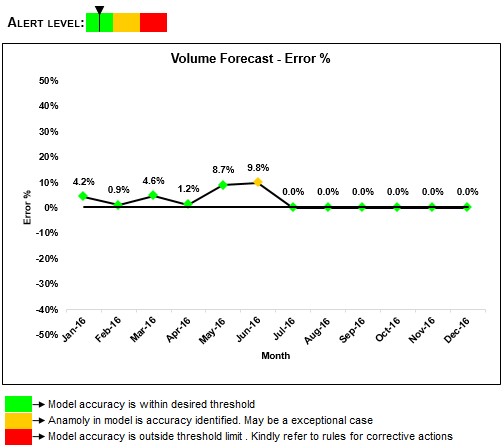
Fig1: The most recent data available is till Jun-16. An amber alert indicates that an anomaly is identified but this is most likely an exception case.
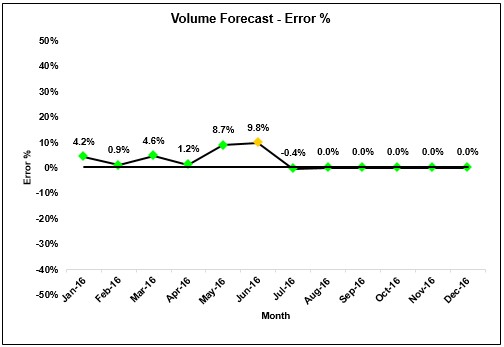
Following are possible scenarios based on actual data for Jul-16.
Case 1
Process in control and no change to model required.
Case 2:
A red alert is generated which indicates model is not able to capture some macro-level shift in the industry behavior.
Any single data point falls outside the 3σ limit from the centerline (i.e., any point that falls outside Zone A, beyond either the upper or lower control limit)
- Two out of three consecutive points fall beyond the 2σ limit (in zone A or beyond), on the same side of the centerline
- Four out of five consecutive points fall beyond the 1σ limit (in zone B or beyond), on the same side of the centerline
- Eight consecutive points fall on the same side of the centerline (in zone C or beyond)
If any of the rules are satisfied, it indicates that the existing model needs to be re-calibrated.
Key Impact and Takeaways
- Quantify and develop benchmarks for error limits.
- A continuous monitoring system to check if predictive model accuracies are within the desired limit.
- Prevent undesirable escalations thus rationalizing operational costs.
- Enabled through a visualization platform. Hence does not require strong analytical
expertise.