Data Augmentation For Deep Learning Algorithms

Plentiful high-quality data is the key to great deep learning models. But good data doesn’t come easy, and that scarcity can impede the development of a good model. It’s relatively easy for a model to identify things from an image when everything is ‘Just Right’ —the correct illumination and zoom level, the right perspective etc. But when the images are not so ideal, the model struggles to give a reasonable prediction. So typically, one would want to train a network with images which are ‘not so ideal’ to help it predict better. But how do you get such data? Well, you basically fake it by taking a regular image and using data augmentation.

Smart approaches to programmatic data augmentation can increase the size of your training set 10-fold or more. Even better, your model will often be more robust (and prevent overfitting) and can even be simpler due to a better training set. What you are trying to do is teach your neural network about something called invariance, which is basically the ability to recognize (“classify”) the object regardless of the conditions that it is presented in —conditions like size, viewpoint, illumination, and translation.

To generate augmented data libraries like Augmentor and imgaug could be used. These Python packages are designed to aid the artificial generation of image data for machine learning tasks. Below are a few examples (and not an exhaustive list) of the different augmentations you can try out when training a model.

Black and White
This augmentation converts the image into a black-white image. It helps in making the model invariant to colour.

Brightness
Brightness augmentation helps in simulating day or night scenarios in images. This improves the model’s prediction in differently lit scenes.

Contrast
This augmentation enhances the contrast of the image and can help in proper differentiation between different features in an image.

Flip Random
Flipping the image vertically or horizontally helps a model become invariant to orientations and positions of the objects in an image.

Gamma Adjustment
This augmentation controls the luminance of an image.

HSV Shifting
This augmentation shifts the hue channel of an image and should help the network become colour invariant.

Rotate without crop
The rotation augmentation makes the network invariant to orientation of objects in the image.

Rotate with crop
Unlike Rotate without crop (previous augmentation), you don’t get ‘black areas’ on the sides of the image and is the preferred approach for semantic segmentation tasks.

Random Distortion
This method is useful when you need to predict objects that don’t have a fixed shape. For example, detecting water bodies from satellite images etc.


Random Erasing
Random erasing selects a rectangle region in an image and erases its pixels with random values. This helps the network predict correctly even when part of the object is occluded.

Skew Tilt
This augmentation tilts the image in a random direction by an arbitrary amount. This helps with predictions when the object is viewed from different angles.


Salt and Pepper Noise
This technique adds artificial noise to the image. It is used to prevent a model from learning high frequency features that may not be useful and helps prevent over fitting.

Shear
This augmentation shears the image by an arbitrary amount.

Rain
This augmentation adds artificial rain in the image and is used widely to train autonomous driving models.

Zoom
This augmentation zooms in an image by an arbitrary amount. It helps the network invariant to size and also to predict well when part of the object is not in the image.

Polygon Shadow
This augmentation creates artificial shadows in images. This technique is frequently used in training self-driving car models.

Now that we have seen few of the augmentation techniques, a question that may arise is, how do you make sure that a data augmentation technique is going to be relevant for you? Well, you typically do that manually - you figure out what the problem space is, the possible scenarios and pick and choose.

The problem with this approach is that we all have biases, conscious or otherwise. These could be something as simple as incorrect assumptions. These biases, along with the fact that this is still an evolving field, and we just don’t know what and how much augmentation to optimally do, result in a lot of guesswork.

However, all hope is not lost, and you should know there is some excellent work being done out there in figuring out the optimal data augmentation strategy for a given problem. Google, for example, has released AutoAugment, where they use Reinforcement Learning to figure out which combination of data augmentation techniques works best for your specific problem space and dataset.

Hope this article shed some light on image data augmentation for deep learning. If you have any questions, you can send me an email at balu.nair@affine.ai

HowStat – Application Of Data Science In Cricket

Data science helps us to extract knowledge or insights from data- either structured or unstructured- by using scientific methods like mathematical or statistical models. In the last two decades, it has been one of the most popular fields with the rise of all big data technologies. A lot of companies have been using recommendation engines to promote their products/suggestions in accordance with users’ interests such as Amazon, Netflix, Google Play. A lot of other applications like image recognition, gaming, or Airline route planning also involves the usage of big data and data science.

Sports is another field which is using data science extensively to improve strategies and predicting match outcomes. Cricket is a sport where machine learning has scope to dive into quite a large outfield. It can go a long way towards suggesting optimal strategies for a team to win a match or a franchise to bid a valuable player.

Under the International Cricket Council (ICC), there are 10 full-time member countries, 57 affiliate member countries, and 38 associate member countries, which adds up to 105 member countries. We cannot imagine the amount of data that will be generated every day for 365 days with the ball-by-ball information of 5,31,253 cricket players in close to 5,40,290 cricket matches at 11,960 cricket grounds across the world. Database maintenance has already been present in cricket for a long time back and simple analysis has also been used in the past. We have the scores of each match with all the details which have been used to generate stats like, highest run scorer, highest wicket-taker, best batting/bowling average, the highest number of centuries in away matches, best strike rate, the highest run scorer in successful chases and much more. In recent years, the depth of analysis has reached a whole new level.

The most popular use of mathematics in cricket is the Duckworth-Lewis system (D/L). The brainchild of Frank Duckworth and Tony Lewis, this method helps in resetting targets in rain-affected limited overs cricket matches. The D/L method is widely used in all limited overs international matches to predict the target score. It is a statistical formula to set a fair target for the team batting second, based on the score achieved by the first team. It takes into consideration the chasing side’s wickets lost and overs remaining. The predicted par score is calculated at each ball and is proportional to a percentage of the combination of wickets in hand and overs remaining. It is simple mathematics and has a lot of flaws. This method seems to be more beneficial for the team batting second. It does not account for changes in the proportion of the innings for which field restrictions are in place compared to a completed inning. V Jayadevan, an engineer from Kerala, also created a mathematical model alternative to the D/L method but it did not become popular because of certain limitations.

Machine Learning algorithms can be used to identify complex yet meaningful patterns in the data, which then allows us to predict or classify future instances or events. We can use data from the first innings, such as the number of deliveries bowled, wickets left, runs scored per deliveries faced and partnership for the last wicket, and compare that against total runs scored. Machine learning techniques like SVM, Neural Network, Random Forest can be used to create a model from the historical first innings data, considering the teams playing the match. The same model can be used to predict the second innings which is interrupted by rain. This will give a more accurate prediction than the D/L method, as we are using a lot of historical data and all relevant variables.

Another application is the WASP (Winning and Scoring Prediction), which has used machine learning techniques that predict the final score in the first innings and estimates the chasing team’s probability of winning in the second innings. However, this technology has been used in very few tournaments as of now. WASP was created by Scott Brooker as part of his Ph.D. research, along with his supervisor Seamus Hogan, at the University of Canterbury. New Zealand’s Sky TV first introduced the WASP during the coverage of their domestic limited overs cricket. The models are based on a database of all non-shortened ODI and 20-20 games played between top-eight countries since late 2006 (slightly further back for 20-20 games). The first-innings model estimates the additional runs likely to be scored as a function of the number of balls and wickets remaining. The second innings model estimates the probability of winning as a function of balls and wickets remaining, runs scored to date, and the target score. Let V(b,w) be the expected additional runs for the rest of the innings when b (legitimate) balls have been bowled and w wickets have been lost, and let r(b,w) and p(b,w) be, respectively, the estimated expected runs and the probability of a wicket on the next ball in that situation. The equation is –

V(b,w) =r(b,w) +p(b,w) V(b+1,w+1) +(1-p(b,w)))V(b+1,w)

Factors like the history of games at that venue and conditions on the day (pitch, weather etc.) are considered and scoring rates and probabilities of dismissals are used to make the predictions.

Other successful applications of data science in cricket are –

  • “ScoreWithData”, an analytics innovation from IBM, had predicted that the South African cricketer Imran Tahir would be ranked as the power bowler, 7 hours before the first quarter final of the 2015 world cup.

South Africa went on to win the match on the back of an outstanding performance by Tahir.

  • “Insights”, an interactive cricket analysis tool developed by ESPNCricInfo, is an amalgamation of cricket and big data analytics.
  • In the last T20 World cup in 2016, ESPNCricInfo did some advanced statistical analysis before the start of each match, viz. when Ravichandran Ashwin takes 3 wickets, India’s chance of winning the match increases by 40%.

But, the application of data science has been used more extensively in other sports like football. The German

Football Association (DFB) and SAP had developed a “Match Insights” software system which helped the German national football team to win the 2014 World Cup. Billy Beane of “Money Ball” fame was successful by taking the drastic step of disregarding traditional scouting methods in favor of detailed analysis of statistics. This enabled him to identify the most productive players irrespective of the all-around athleticism and merchandise-shifting good looks that clubs had previously coveted.

The future of big data and machine learning is indeed very bright in the world of cricket. While the bowlers shout “Howzat” to try and clinch wickets, we as data scientists, with the help of machine learning and big data, can pose the question: HowStat?

References

The Evolution Of Data Analytics – Then, Now And Later

The loose definition of data science is to analyze data of a business, to be able to produce actionable insights and recommendations for the business. The simplicity or the complexity of the analysis, aka the level of “Data Science Sophistication” also impacts the quality and accuracy of results. The sophistication is essentially a function of 3 main data science components – technological skills, math/stats skills and the necessary business acumen to define and deliver a relevant business solution. These 3 pillars have very much been the mainstay of data science ever since it started getting embraced by the businesses over the past two decades and should continue to be even in the future. What, however, has changed or will change in the future is the underlying R&D in the areas of technology and statistical techniques. I have not witnessed many other industries where these skills are becoming obsolete at such fast rate. Data Science is unique in its requirement of the data scientist and the consulting firms to constantly update their skills and be very futuristic in adopting new and upcoming skills. This article is an attempt to look at how the tool/tech aspects of data science have evolved over the past few decades, and more importantly what the future holds for this fascinating tech and innovation driven field.


THEN > NOW > LATER

When businesses first started embracing data science, the objective was to find more accurate and reliable solutions than those obtained using business heuristics. At, the same time trying to keep the solutions simple enough so as to not overwhelm the business users. The choice of technology was kept simple for easier implementation/consumption and the same went for math/stat too for easier development and explanation. The earlier use cases were more exploratory than predictive in nature and hence that also impacted the choice of tools/techs. Another important factor was availability in the market in terms of the products and more importantly the analysts with those skills.

  • Data Processing

SAS, that used to be one of the workhorses of the industry during the 2000s when it came to data processing/EDA jobs, building backend data for reporting and modeling. A few companies used SAS for EDW too which otherwise was dominated by IBM Netezza, Teradata, and Oracle. SPSS found a good use too owing to its easy to use GUI interface as well as the solution suite it offered that included easy to develop (but quite handy) solutions like CHAID/PCA etc.

  • Predictive Modeling

The so-called “Shallow Learning” techniques were the most common choices (due to the availability of products and resources) when it came to building statistical models. These mostly included linear regression, Naïve Bayes, logistic regression, CHAID, univariate and exogenous time series methods like smoothing, ARIMA, ARIMAX etc. for supervised and K-Means clustering, PCA etc. for the unsupervised use cases. Toolkits like IBM CPLEX or excel solvers were mostly used to address optimization problems due to their ease of implementation.

  • Visualization

Reports were mostly developed and delivered on excel and VBA for complex functionalities. Cognos, Micro strategy were some of the other enterprise tools, typically used by large organizations.

  • Sought Skillsets

Due to the nature of work described above, the skillset required were quite narrow and limited to what was available off the shelf. The data science firms typically hired people with statistics degree and trained them on the job for the required programming skills which were mainly SQL, SAS and sometimes VBA programming.

THEN > NOW> LATER

  • Data Processing

Python & R are the main technologies for the daily data processing chores for today’s data scientist. They are open source tools, have vast and ever-evolving libraries, and also an ability to integrate with big data platforms as well as visualization products. Both R & Python are equally competent and versatile and can handle a variety of use cases. However, in general, R is preferred when the main objective is to derive insights for the business using exploratory analysis or modeling. Due to its general-purpose programming functionality, Python is typically preferred for developing applications which also have an analytics engine embedded in them. These two are not only popular today but they are here to stay for some more years to come.

An important disrupter has been the area of the distributed processing framework, pioneered by two Apache Open Source Projects – Hadoop & Spark. Hadoop picked up steam in the early 2010s and is still very popular. When it was introduced first, Hadoop’s capabilities were limited when compared to a relational database system. However, due to its low cost, flexibility, ability to quickly scale but more importantly with the development of many maps/reduce based enablers like Hive, PIG, Mahout etc., it started to deliver benefits and is still the choice of technology in many organizations that produce TBs of data daily.

While Hadoop has been a pioneer in the distributed data processing space, it lacked performance when it came to using cases like iterative data processing, predictive modeling/machine learning (again iterative in nature due to several steps involved) and real time/stream processing. This is mainly since MapReduce reads and writes back the data at each step and hence increasing latency. This was addressed with the advent of Apache Spark which is an in-memory distributed framework and holds the data in memory to perform a full operation (the concept of Resilient Distributed Datasets (RDD) makes it possible). This makes it many times faster than Hadoop’s MapReduce based operations for the use cases mentioned before. More imp, it’s also compatible with many programming languages like Scala, Python or Java and hence the developers can use the programming language of their choice to develop a spark based application

  • Predictive Modeling

The machine learning space also witnessed many advancements with organizations and data scientist using more and more “deeper” techniques. These are far better than the linear and logistics regressions of the world as they can uncover complex patterns, non-linearity, variable interactions etc. and provide higher accuracy. Some of these techniques are captured below

Supervised – GBM, XGBoost, Random Forests, Parametric GAMs, Support Vector Machines, Multilayer Perceptron

Unsupervised – K-nearest Neighbours, Matrix Factorization, Autoencoders, Restricted Boltzmann Machines

NLP & Text Mining – Latent Dirichlet Allocation (to generate keyword topic tags), Maximum Entropy/SVM/NN (for classification for sentiment), TensorFlow etc.

Optimization – Genetic Algorithms, Simulated Annealing, Tabu Search etc.

Ensembling (blending) of various techniques is also being adopted to improve the prediction accuracy by some of the organizations.

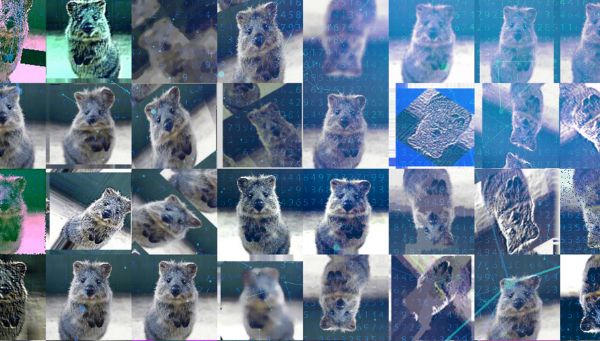
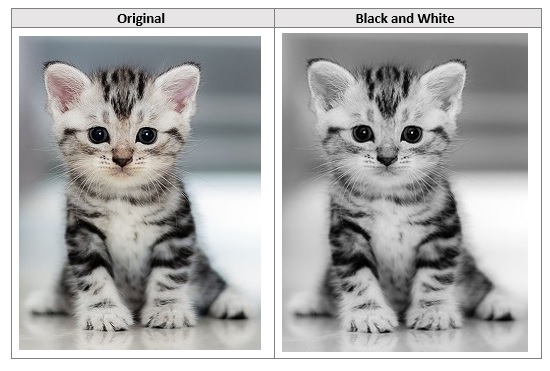
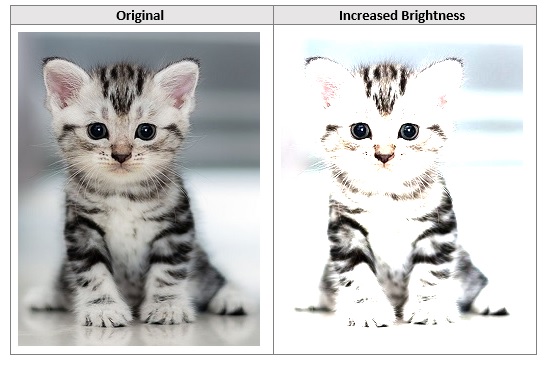
While the techniques described above are “deep” in the sense that they are more complex than their predecessors, these should not be confused with the whole different area of “Deep Learning” which, as of today, is finding more applications in the AI/Computer Vision spaces. While the “Deep Learning Models”, esp. Deep Convolutional Network, can be trained on structured data to solve the usual business use cases, they are mostly employed in the areas of image classification/recognition and image feature learning. One of the reasons behind Deep Learning not making headway into regular business use cases is because they are more resource intensive to develop, implement and maintain. These typically require advanced GPUs for development and may not be worthy for a regular business use cases unless justified by the ROI due to increased accuracy. However, a few organizations (non-tech) have started using them to develop non-AI predictive use cases because of accuracies offered that translated into higher ROIs.

  • Visualization

While most organizations favored off the shelf products like Tableau, QLikview, ELasticSearch Kibana etc., many are also adopting open source technologies like D3 and Angular as a low-cost option to develop customized and visually appealing and interactive web as well as mobile dashboards. The library offers several reusable components and modules which make development fast.

  • Sought Skillsets

With the advancements in both technology and algorithm fronts as well as the variety of business use cases asked by the organization, data science firms started looking for open-minded thinking, fundamental programming techniques, and basic mathematical skill sets. People with such skills are not only agile at solving any business problem but also flexible in learning new and evolving technologies. It is far easier for such data scientists to not only master R or Python but also quickly go over the learning curve for any emerging technology.

THEN > NOW > LATER

Given the current data science trends, the ongoing R&D and more importantly some of the use cases that businesses have already started asking about, the future of data science would be heavily focused on 3 things – Automation, Real Time Data Science Development (not scoring) aka the Embedded Data Science and obviously “Bigger Data”. This should spark the need and emergence of new data science paradigms in the areas of database handling, programming ecosystems, and newer algorithms.  More importantly, it will become critical for data scientists to be constantly aware of the ongoing R&D and proactively learn the emerging tools and techniques and not just play a catch-up game – something that’s not good for their career.

Amongst the technologies already in use, Scala, Python, Pyspark and the Spark Ecosystem should remain the main choice of technology for the coming 2-3 years at least. Julia hasn’t picked up much steam in the mainstream data science work, but is a fairly useful option due to its similarity with python and offering better execution speeds on the single threaded system for a good number of use cases. However, Julia may require more development and improvement of libraries before it really starts getting adopted as one of the default choices.

One of the main bets, however, would be Google’s Go programming language. One of the main advantages that GOlang offers is that it enables data scientists to develop “production ready” data science codes/services/applications. The codes written on single-threaded languages are typically very hard to production coupled with the huge amount of effort required to transition the model from the data scientist’s machines into a production platform (testing, error handling and deployment). Go has performed tremendously well in production allowing the data scientists to develop scalable and efficient application right from the beginning than a heavyweight python based application. Also, its ability to handle and report errors seamlessly ensures that the integrity of the application is maintained over time.

On the algorithm front, we hope to see more development and adoption in the areas of Deep Learning for regular business problems. As explained before, most of the applications of Deep Learning as of today are in the areas of image recognition, image feature analysis, and AI. While this area will continue to develop and we will see highly innovative use cases, it will be great to use these algorithms to solve regular business use cases. We should also see more adoption in the areas of boosting based algorithms – traditionally these required meticulous training (in order not to overfit) and a large amount of time due to a huge no. of iterations. However, with the latest advancements like XGB and LightGBM, we can expect to see more improved versions of boosting as well as increased adoption.

The area of “Big Data Visualization” would see more adoption. Interactive Visualizations developed on the top of streaming data would require a versatile skillset. Building NodeJS and AngularJS applications on the top of Spark (Spark streaming, Kafka) and tapping into the right database (mongo or Cassandra) would remain one of the viable options. Apache Zeppelin with Spark should also see more adoptions especially as it continues to be developed.

The data science industry is evolving at an exponential space – whether it’s the type of use cases it is addressing or the shift and availability on the tool/technology space. The key to a successful data science practice would be to hire individuals who are constantly aware of the R&D in tool/tech space and not afraid to embrace a new technology. Like a good forecast model, a good data scientist should evaluate available inputs (i.e. tech options already in use or under dev) and predict what’s be the best option(s) for tomorrow.

Changing Business Requirements In Demand Forecasting

Affine recently completed 6 years, I have been a part of it for about 3 of those years. As an analytics firm, the most common business problem that we have come across is that of forecasting consumer demand. This is particularly true for Retail and CPG clients.

Over the last few years have dealt with simple forecasting problems for which we can use very simple time-series forecasting techniques like ARIMA and ARIMAX or even linear regression these are forecasts which are more at an organization or for specific business divisions. But over the years we have seen a distinct shift in focus of all our clients to get forecasts at a more granular level, sometimes for even specific items. These forecasts are difficult to attain using simple techniques. This is where more sophisticated techniques come into play. These techniques are the more complex machine learning techniques which include RF, XG Boost etc.

We cater to various industry domains and verticals and to explain how the clients’ requirements have changed over the years I can think of two very distinct examples from two specialty domains, video gaming industry and sportswear manufacturer and retailer. Below I will try to explain how the business requirement for a forecast was different for both these clients.

Video Game Publisher

Over the last few years, the popularity of one franchise belonging to the publisher has gone down due to various factors. The stakeholders wanted to understand the demand pattern for the franchise going forward and they wanted monthly predictions for the franchise’s sales for the next 1 fiscal year. This franchise contributed to almost 60% – 70% of the organization’s revenue and we were required to predict the sales for only this franchise. Also since this was a month level forecast/prediction we had which are primarily black box techniques being appropriate for this requirement. enough data points to use either a time series analysis or even a regression analysis to predict sales. We tried both and finalized on a regression-based analysis so that we could also identify the drivers for sales and their impact which was important for the stakeholders.

Sportswear Manufacturer and Retailer

In the case of the sportswear manufacturer and retailer client, they wanted weekly forecasts for all the styles available in their portfolio. Hence the client required predictions for all the items available for all the weeks in a fiscal year.

There are a lot of items here which are newly launched items having very few data points at a week level. Here, the traditional time-series methodology will fail because of lack of data points, also not all the styles will showcase similar trend and seasonality. Along with this, there will also be styles which have minimal sales and prediction for these styles is a major challenge for this client. We had to develop an ensemble of models where we divided all the styles into few buckets of

  • High volume – high duration
  • High volume – low duration
  • Low volume – high duration
  • Low volume – low duration and completely new launches.

For the styles that have high volume and high duration, we can still use a time-series or a regression technique but for all the others these traditional methods will have limitations. Hence, we needed to apply ML techniques for these styles.

For the styles with low duration, we used Random forest and XGB methods to arrive at the predictions. Also for these styles what was more important was to get a proper demand prediction rather than identify the drivers of sales and their impact, hence ML techniques.

Conclusion

As an analytics practitioner, we recognize that there is no one-size-fits-all approach to data analysis. To identify the best approach, one needs to have a deep knowledge and practical experience in various approaches.  This was established in our recent experiences. While the video game publisher’s requirement was primarily for an entire franchise for which we could use simple time series and regression techniques, the sportswear retailer’s requirement was much more granular. In another experience with the sportswear retailer, item level predictions were the prime requirement and over time we as an analytics firm have seen this change in requirement from an overall demand prediction too much more granular predictions across the board. Also, most of our clients tend to make informed decisions about how much inventory to produce and stock for each item and a granular prediction at an item level aids that.

Analytics For Non Profit Organisation

Analytics have been growing at a rapid pace across the world. The well-established companies have realized the importance of analytics in their business where crucial decisions are taken that drives their revenue. But why do just the well-established corporates need to leverage this statistical and computational modus operandi when it can be implemented in a much-needed arena also?

The idea is to get to use the analytics for non-profit social organizations and provide a breakthrough. These are the organizations which strive to look for the upliftment of society by identifying the social responsibilities. The organizations cover a wide variety of aspects that helps to promote education, health, food, shelter etc

There are three main categories where the power of analytics could be utilized to its full potential:

  • Fundraising
  • Churn analysis
  • SROI (Social Return On Investment)

Fundraising analytics

One of the major factors that would help the NGO’s grow financially would be the fundraising. It involves planning and execution of offline and digital campaign to spread the awareness to the public and let the outside world know the work that’s been happening in the organization.

The fundraising analytics points down to studying the behavior of the donors. The first step towards understanding the behavior would be careful segmentation of the donor population. It then paves the way in categorizing the donor based on the segments. Later, targeting/recommendation can be carried out by considering the distinguishing factors like the previous donating patterns of the donors, average calls to the donor, his financial stability etc. The cause for fundraising will always be the major driver as different audience respond to different social cause like LGBT, cancer awareness, Women empowerment etc.

Churn Analysis

Churn analysis throws light in the arena of child education in non-profit organizations. The rising issue in every state in India would be the number of students who are dropping out of school. These students need to be given financial support to pursue the education back. Let’s assume that each student needs to be helped with Rs 5000 with this education for a year. Assuming they are targeting 10000 kids, then their expenditure would be 50 Mm. By implementing analytics in their background, say they employ 1,00,000 they can work on concentrating the 10% of the kids who have a very high propensity in dropping out. The expenditure becomes 5Mm and it gives a wider view of the people dropping out.

SROI (Social Return on Investment)

SROI is similar to the concept of Return On Investment(ROI) where in addition to the financial factors, the social and the environmental outcome also play a major role in determining the health of a Non-Profit Organisation.

SROI = (Tangible + Intangible value to community) / Total resource investment

The concept of SROI in NGO’s lie by the principle of associating the socio and environmental outcomes into a dollar value. Let us take an example of gender discrimination that happens in many parts of the world.

The possible outcome after solving the gender discrimination:

  • Women getting good quality education equal to men
  • Women getting the job opportunity and earn a living through it
  • Spreading awareness to the fellow community group

Now to measure the SROI in this scenario one should think of associating the financial equivalent of the above outcomes so that every single achievement is being communicated through dollar value.

In the first case, the women attaining education would involve the fees that are paid for each girl student. Secondly, the job opportunity would involve income to the women groups that contribute to SROI. Finally, scaling up the idea across the society will help in augmenting the first two steps across oceans and islands.

Under the umbrella of analytics, the SROI will be implemented with the help of a classifier to predict the outcome of the SROI. With the above example, there are 3 Business questions that can be answered

  • Whether the women will get a quality education or not
  • Whether the women will get a job opportunity or not
  • Whether the women will be spreading awareness or not

Based on the several factors like demographics, # of siblings, Qualification of parents and occupation of parents we will be able to finally offer a prediction. This will yield us with the women population achieving the expected outcome in the problem of gender equality. Eventually, the Net Financial Worth associated with the outcomes (Similar to the Net worth in case of GDP of a country) discussed and the time involved in achieving this would yield us the Investment.

So, the aforementioned arena of discussion proves the application of analytics in such a domain that would need enormous and endless support. The set of procedures will be able to clearly guide many social organizations to leverage the domain’s capability with the careful use of resources available.

IoT And Analytics In Auto Insurance

Internet of Things (IoT) is a network of connected physical objects embedded with sensors. IoT allows these devices to communicate, analyze and share data about the physical world around us via networks and cloud-based software platforms.

In the current scenario, IoT is one of the most important phenomena revolutionizing the technological and business spheres. Several industries such as Agriculture, Healthcare, Retail, Transportation, Energy, and manufacturing are leveraging IoT to solve long-standing industry-wide challenges and thus transforming the way they function. For example, in Manufacturing, sensors placed in the various equipment collecting data about their performance are enabling pre-emptive maintenance and providing insights to improve overall efficiency. In Retail, “things” such as RFID inventory tracking chips, in-store infrared foot-traffic counters, digital signage, a kiosk, or even a customer’s mobile device is enabling retailers to provide location-specific customer engagement, in-store energy optimization, real-time inventory replenishment, etc.

The Insurance industry, on the other hand, has been rather sluggish by virtue of its size and inherent traditional nature. They cannot, however, afford to continue a wait-and-watch attitude towards IoT. Insurance is, interestingly, one of the industries that are bound to be most impacted by various technological leaps that are being made. IoT, blockchain, Big Data are all expected to push Insurance to evolve into a different beast altogether, including a shift from restitution to prevention.

Primary IoT Use-cases That Insurers Have Adopted

  1. Connected cars: Many auto insurers have been collecting and analyzing data from sensors in cars to track drivers’ behaviors real-time and thus providing usage-based insurance (UBI).
  2. Connected homes: Sensors in homes that can detect smoke and water levels can lower frequency and severity of damages by automatically sending out messages to the homeowners, fire department or other maintenance service providers, in any event, requiring attention. Certain connected doorbells are capable of preventing burglaries, while other devices provide remote home surveillance.
  3. Connected people: Wearable fitness trackers provide data to insurers that help them underwrite their health insurances better and advice preventive care. These trackers also enable the wearers to lead a healthier lifestyle, thus reducing their premiums and frequency and severity for the insurers.

Though some of the content can be applicable to other Lines of Business, in this article, I shall focus on leveraging IoT in Auto Insurance. Please note that the steps and assumptions of actions taken are based on a specific case study. The specificities may vary for other Insurance providers based on existing policies, location, technological and data maturity, etc. The intention is to provide a detailed example. This study can be replicated for other providers and recommendations can be made accordingly.

IoT has the potential to impact almost every facet of Auto Insurance. The preventive and underwriting areas have already received sufficient focus. Data from sensors in the cars can help understand and analyze driver behavior and thus profile risky driving behavior. This has enabled a much-appreciated shift from usage-based underwriting from the traditional demographic-based underwriting. Here, it is important to point out that just driving behavior metrics such as speed and number of sudden breaks is not sufficient to assign a risk profile to the driver. These metrics should be analyzed in the context of the location, usual routes were taken, average driving behavior in the area, etc. to truly judge one’s driving behavior. This requires assimilation of multiple data sources.

Claims Management

The insurance buyer demographic has shifted to one that prefers everything here and now. They prefer dealing with things remotely from the comfort of their offices and consider the need of heavy paperwork and human presence primitive. Application of IoT in the improvement of Claims management is at a very nascent stage but could have a tremendous impact on the claim handling turn-around time, accuracy of investigation and customer satisfaction.

1.Accident/Event and FNOL

2.Workshop Assignment

3.Investigation and Fraud detection

4.Miscellaneous

  • Document maintenance: Since a lot of hard-copy of documents are still used in Insurance, RFID can be used for document tagging and maintenance.
  • Once the repair has been completed, the various sensors of the car can do a self-check to ensure the parts they are connected are in good working condition.
  • Feedback: The mobile app will be a much more effective method of collecting feedback from the customers than paper forms and telephone calls.

The Wealth of Data Generated

  • As discussed above, underwriting of policies will improve drastically even for 1st-time buyers.
  • Efficient visualization and automated insight generation to provide reliable and concise.information about their driving behavior to the drivers themselves will help them become safer drivers.
  • IoT-based analytics can be used to predict future events such as:
    1. Major weather patterns – Based on this Insurance companies can prepare for various catastrophes and improve locality-based underwriting.
    2. The data will enable Insurance companies to identify accident-prone weather, roads, driving behavior and combinations thereof. The Insurer can then advise the driver accordingly. For example, the insurer may inform the driver that he ought to avoid a particular route in a particular kind of weather since accident probability of that combination would be 30%.
  • With all the additional data, various important profiles and segments may emerge that will form the foundation for propensity estimation and developing effective targeting strategies.

Criticality Of Analytics In Utilizing IoT Data

Analytics is a critical component of using IoT data to ensure maximum benefi

  • Policy buyer level information can be used to evaluate the risk associated with the buyer and legitimacy of claims
  • Analyzing the population as such can identify customer segments and determine their needs. Coupled with efficient visualization and automated insight generation, insurers will be able to promptly determine any concern and the cause for the same
    1. The data will enable Insurance companies to identify accident-prone weather, roads, driving behavior and combinations thereof. The Insurer can then advise the driver accordingly. For example, the insurer may inform the driver that he ought to avoid a specific route in a particular kind of weather since accident probability of that combination would be 30%.
  • Analysts can identify significant trends and patterns from data accumulated over a period. This can be incorporated into statistical models that can predict the future for insurers
    1. Based on expected weather patterns and catastrophes, insurance companies can prepare accordingly and improve locality-based underwriting.
  • The various policy changes and tests by the insurance companies to deal with changes in the market will also be reflected in the IoT data. This information can be used to determine the optimal action to be taken when an immediate or expected issue needs to be mitigated

IoT Implementation For Insurance Companies

  • In an ideal world, any kind of transformation would be a series of steps with minimal overlap between each other. This is, however, not reality. Insurance companies have assumed that they cannot move on to integrating IoT in claims management until the current data and processes have all been completely digitized. One would like to imagine that given the amount of time and money that has gone into digitization, all organizations above at least mid-size would have all their data digitized and well-synchronized. The reality is, however, a combination of traditional and digitized systems. While a complete online data mart would have been the ideal scenario for IoT integration and to derive the best from it, IoT can also be integrated into such combination systems and still add substantial value by syncing with whatever data is online and clean.
  • Analytically sound database structure and ease of analysis are critical while setting up IoT system. The database design should be in such a way that all the required information should be stored without error and all current and future analysis can be carried out with relative ease. This can be done only under the supervision of able and experienced analytics practitioners.
  • IoT for usage-based insurance is no longer a choice for providers. If they do not implement it right away, they will be left with a policy portfolio of higher risk drivers.
  • Managing voluminous multisource data and organizing the technological resources.

References

Copyright © 2024 Affine All Rights Reserved

Manas Agrawal

CEO & Co-Founder

Add Your Heading Text Here

Lorem Ipsum is simply dummy text of the printing and typesetting industry. Lorem Ipsum has been the industry's standard dummy text ever since the 1500s, when an unknown printer took a galley of type and scrambled it to make a type specimen book. It has survived not only five centuries, but also the leap into electronic typesetting, remaining essentially unchanged.